Leading experts in cloud monitoring share practical strategies for optimizing application performance across modern infrastructures. This comprehensive guide explores seven critical approaches including OpenTelemetry implementation, strategic logging practices, and the integration of RUM with APM systems. Discover how combining observability with automation creates resilient cloud applications that deliver consistent performance at scale.
- OpenTelemetry for Vendor-Agnostic Cloud Monitoring
- Datadog for Complete Application Visibility
- Focus on Layered Observability Principles
- Unify RUM and APM with Middleware
- Prometheus and Grafana with Automated Scaling
- Combine Observability with Proactive Automation
- Strategic Structured Logging for Analysis
OpenTelemetry for Vendor-Agnostic Cloud Monitoring
There are multiple open source options for monitoring and managing cloud applications; however, the most widely adopted solution is “Open Telemetry,” which provides us with a unified way to collect, process, and export metrics, logs, and traces from your applications, and it can easily integrate with other tools and technology stacks. For visualization, we can easily integrate with other popular tools like Grafana, Prometheus, Jaeger, and SigNoz, which commonly support both cloud as well as on-premise deployments.
As an expert in .NET and Microsoft technology stack, I am deeply involved in building cloud-native and distributed systems. OpenTelemetry is an undisputed leader for monitoring and managing performance for cloud applications, and I have hugely benefitted from using it in production deployed systems to observe the performance of complex distributed systems. OpenTelemetry is a project of Cloud Native Computing Foundation (CNCF), which guarantees that telemetry (log) collection is uniform across all different programming languages and environments by eliminating vendor lock-in. Almost all the popular cloud providers accept and support OpenTelemetry, including but not limited to AZURE, AWS, GCP, Oracle Cloud, etc.
Why is OpenTelemetry the experts’ choice? Mainly due to the below features:
a. Language and vendor agnostic: Supports almost all modern languages and any cloud providers
b. Flexibility at scale: Easily integrated into other open source tools for visualization
c. Community and industry adoption: OpenTelemetry is a CNCF project and backed by almost all major cloud providers. Also, there is strong community support from developers on this project.
OpenTelemetry is especially valuable for organizations that want a transparent, extensible, future-proof monitoring stack which can work great in hybrid, multi-cloud, or in single cloud settings. OpenTelemetry is not just any tool; it’s a backbone for creating modern distributed cloud systems, and every developer needs to know about OpenTelemetry and keep it in their arsenal. By adopting OpenTelemetry in your cloud-native applications, it’s easier to identify real-time issues, and you as a developer can identify a real issue before your stakeholder/customer can complain. It helps with predictive analysis and improves reliability and transparency in your applications. OpenTelemetry is redefining the way how software applications are monitored, optimized, and trusted in the digital age.

Datadog for Complete Application Visibility
My preferred method for monitoring and managing the performance of cloud applications is a mix of real-time observability and proactive alerting. I rely heavily on Datadog because it brings together metrics, logs, and traces in one place, which gives me a full picture of how an application is behaving.
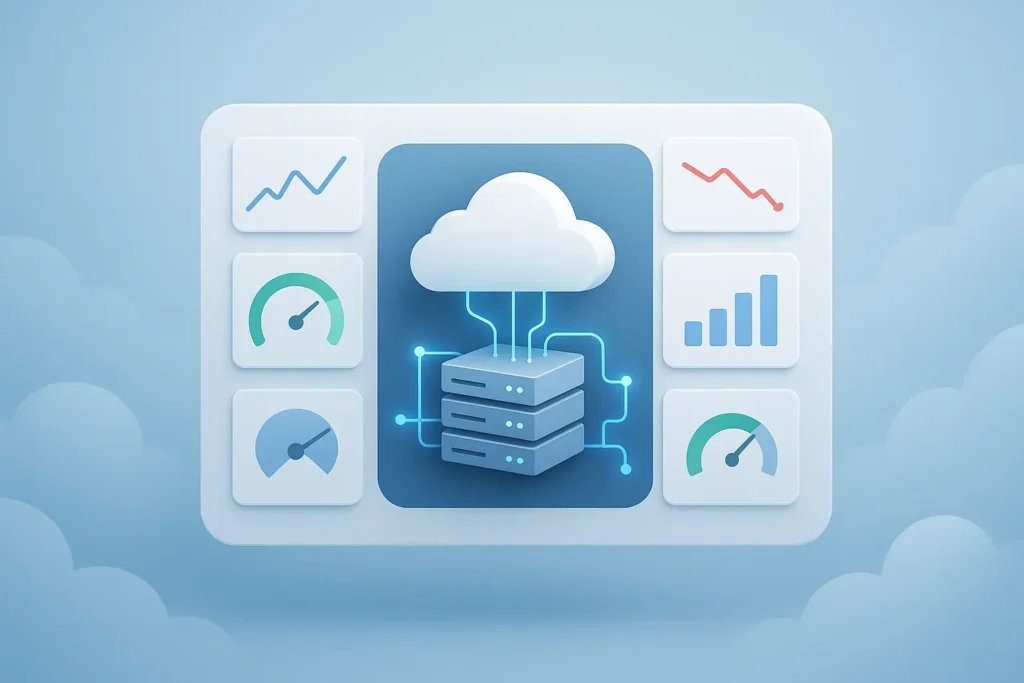
In practice, I set up dashboards to monitor critical KPIs like response times, error rates, and infrastructure health, and configure alerts so the team is notified before an issue impacts users. What I like most is the ability to drill down from a high-level metric into specific logs or traces—it makes root-cause analysis much faster. This approach not only ensures consistent uptime but also helps us optimize resource usage, which directly saves on cloud costs.
For me, the key is visibility: when you can see exactly what’s happening across services in real time, managing performance becomes far more proactive than reactive.

Focus on Layered Observability Principles
As someone who spends most of my time guiding enterprises on cloud adoption, I believe monitoring performance is less about the tools you use and more about the discipline you build around it. Tools change, but the principles of observability remain constant.
My preferred method is to think about it in layers. At the infrastructure level, you need to track system health and resource utilization. At the application level, you should measure response times, throughput, and error rates. And at the business level, you monitor the impact on user experience and revenue. Connecting these layers is what gives you meaningful insights.
Another critical piece is setting clear baselines and thresholds. Too often, teams collect mountains of data but lack a sense of what ‘normal’ looks like for their systems. Defining performance baselines turns noise into actionable signals.
Finally, I’d emphasize culture. Performance monitoring should not be a siloed function run by ops. Developers, architects, and product owners all need visibility. The best-performing organizations I work with treat observability as part of engineering culture. It is not an afterthought and should not be treated as such.
Overall, I’d say the approach matters far more than the dashboard you pick.

Unify RUM and APM with Middleware
For monitoring and managing the performance of cloud applications, I prefer a combination of Real User Monitoring (RUM) and Application Performance Monitoring (APM). This ensures both a user-first perspective and a deep technical view of application health.
RUM captures real-world user interactions across devices, geographies, and networks—helping identify latency issues, errors, or poor UX before they escalate. On the other hand, APM dives into backend services, APIs, and infrastructure dependencies, enabling faster root cause analysis.
A tool I recommend is Middleware, since it brings together RUM, APM, infrastructure monitoring, and log management into one unified platform. This makes it easier to track performance across distributed cloud-native environments without juggling multiple tools.
The real value lies in actionable insights—not just raw metrics. Middleware helps IT and DevOps teams detect anomalies early, improve user experiences, and keep cloud applications reliable at scale.

Prometheus and Grafana with Automated Scaling
In my experience, managing cloud application performance is critical in distributed environments where downtime or latency affects users and business outcomes. Proactive monitoring and strategic management ensure reliable systems and efficient operations, reducing risks before they impact performance.
One method I rely on is implementing Prometheus for real-time metrics collection paired with Grafana for visualization. Tracking indicators like CPU usage, memory consumption, latency, and error rates provides clear insight into application behavior. With these dashboards, it becomes possible to spot trends early, address bottlenecks, and optimize resource usage before they escalate into bigger issues.
Automation is another key part of my strategy. Using Kubernetes Horizontal Pod Autoscaler (HPA), applications can automatically scale based on load. This reduces the risk of performance degradation during peak demand while avoiding unnecessary over-provisioning of resources. Integrating Alertmanager ensures critical issues trigger immediate notifications, enabling quick resolution and minimizing user impact.
For deeper visibility, I also utilize advanced logging and tracing tools, such as the ELK Stack and Jaeger. These allow tracing requests across services and diagnosing issues in complex microservices architectures. Over time, this approach has helped maintain an uptime of over 99.99%, while also improving operational efficiency and reducing manual intervention.
At the core of my approach is continuous monitoring and assessment. I don’t wait for problems to occur. By proactively collecting data, automating responses, and analyzing trends, it’s possible to maintain performance, anticipate challenges, and ensure cloud applications run reliably and efficiently.

Combine Observability with Proactive Automation
For monitoring and managing the performance of cloud applications, the approach I’ve found most effective is combining real-time observability with proactive automation. Tools like Datadog and New Relic stand out because they provide end-to-end visibility, from infrastructure health to user experience metrics, while also enabling predictive alerting before issues impact operations. In practice, the focus isn’t only on detecting problems but also on identifying optimization opportunities—such as resource scaling or cost-efficiency improvements—that directly benefit the business. What makes this approach work is integrating these tools with AI-driven analytics so that the insights are actionable and not just data-heavy dashboards. This blend of continuous monitoring, predictive insights, and automation ensures cloud applications stay reliable, secure, and aligned with evolving business demands.

Strategic Structured Logging for Analysis
Structured logging, done judiciously.
Instead of logging anything and everything developers can think of, log specific events, generally all important failures and only some successes. You want important data, not noise.
Instead of logging random messages, log specific messages and tag them with relevant content, the request IDs, the user IDs, the request information (like keys to lookup for, parameters sent). This is especially important for troubleshooting when it’s an error message. There is rarely a chance to run a live debugging session with the user. You’ll want to be able to figure out errors and fix them from a log line or two.
Ship the logs to a centralized logging service that makes it easy to search and analyze them. With judicious structured logging, you can pull metrics like “how many X performed by users” or “average processing time for Y” in a graph or a single value on the dashboard, which is critical for businesses.


